Recently I have blogged about three DIY IoT devices that I have put up in my house. Some of these devices have been running for past 3 years and uploading data points to one of the three data brokers - Xively or ThingSpeak or Carriots. A few months ago I switch to InitialState.com which has a sleek interface and allows you to analyse your data in a much better visually intuitive way.
So with the following 3 devices collecting data using sensors from inside my house...
...here are the few insights that I gleaned on from analyzing the data:
So with the following 3 devices collecting data using sensors from inside my house...
- Weather station outside - installed in my balcony (temperature, humidity, pressure, light)
- Ambient sensors inside the house next too the bathroom (temperature and humidity)
- Electrical Energy Meter - Monitoring voltages, currents etc on all 3 phases
...here are the few insights that I gleaned on from analyzing the data:
Overview:
 |
| This is what my tiles app looks like with the various data stream being fed from the 3 IoT devices |
 |
| Recently, InitialState.com made changes to their platform to allow decreasing the size of the tiles even further This helps organize and fit in much more information on a single screen. |
 |
| Lines app with all data streams activated. This gives you storage oscilloscope like functionality with cursors and zoom. |
My electricity usage patterns:
 |
| This is the voltage of third electrical phase to which all my water heaters are connected. I can check the days on which I used them (i.e. I took a bath) and days on which I did not (i.e. I did not take a bath) and ... days on which I used them twice or for longer duration (i.e. I had a guest stay over). I was on vacation 7th may on wards, so no water heater usage during the period post that date |
 |
| This is the second electrical phase to which my kitchen appliances (microwave, washing machine and fridge) are connected. The persistent square wave is my fridge's compressor turning on and off. The spikes are the days on which I washed clothes. The smaller spikes are when I used the microwave. |
 |
| This is the voltage on the first phase of my electrical supply. Lights and fans, TV, computer, router are connected to these. You can see the things been turned on and off - evident from discretization. |
 |
| Zoomed out view of the total electrical energy consumed. Obviously it would keep increasing over time. I guess how it accumulates over time depends on the energy meter I am using. |
 |
| If you zoom in, you can figure out the days (flat parts) when there was a power failure for a few minutes |
 |
| Same graph as above. Different color, more zoom. Power failure is clearly seen |
Citizen science - analyzing the weather:
 |
| Detecting Clouds Ambient light being captured by the weather station installed outside. Zoomed in to 4 days worth of data As the Sun moves across the sky, it created a curve. The curve is distorted at the top because there is a pillar in the balcony that casts a shadow on the sensor. You will note that of the 4 days, the graph on the third day is much more smoother. This perhaps indicates that there were no clouds on that day |
 |
| Daily Temperature/Humidity/Light cycles When the sun is at its peak, the humidity is the least and temperature is maximum. |
 |
| The days on which I took bath Lines app showing readings from humidity sensor placed inside my house. The peaks every now and then are the times at which I took bath - opening the bathroom unleashes extremely humid air into the house. |
 |
| Temperature cycling through the day You can not the maximum and minimum temperature. Also its getting cooler on an average.The daily temperature range is 10 degrees centigrade. |
 |
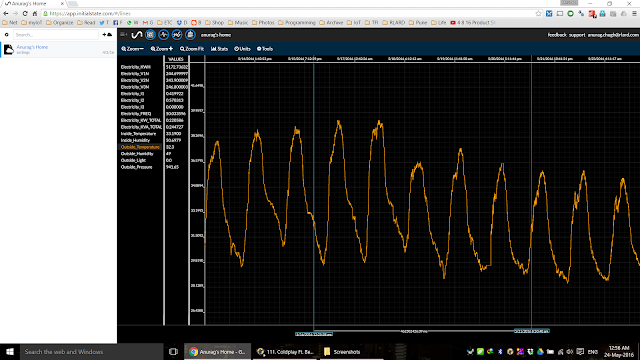
| As the sun rises (light sensor in red), temperature starts rising as well (temperature in orange) |
 |
| Atmospheric Pressure cycles twice a day. Not very clear from here, but unlike temperature, humidity and light which only cycle once a day, atmospheric pressure goes through 2 peaks and troughs in a day. No one taught me this at school |
 |
| Outside temperature and outside humidity plotted together. It is jst fascinating to look at. Nothing new there. |
 |
| Plot of humidity levels inside and outside. The inside humidity levels follows the ones outside. Nothing much to see there. |
 |
| The inside temperature of an unoccupied house is the average of outside temperature. I haven't been living inside the house for the few days that are covered in this graph. The graph shows outside and inside temperature. The outside temperature cycles daily. The inside temperature on the other hand is a smooth curve which sort of looks like the average value of the temperature outside. The insulating effect of the house is responsible for that. |
 |
| How to tell if an house is unoccupied by looking at inside temperature values Inside temperature: On the days I was at home you can see a lot of ups and downs But 7th May on wards, the inside temperature curves is smooth cause there was no one to open and close the windows and doors. |
 |
| Graph of inside temperature and inside humidity. There are much more ups and downs when people are living in the house than when they are not. Opening and closing the doors and windows causes those ups and downs. |